ISCA Trimester Three 2019 High Performance Wrap Up

Braden Woods
Over the course of the year the students made significant gains in strength, speed, lower limb power and upper body strength endurance. Overall, we saw an average increase in performance of 34% over the course of the year (30 weeks of training) from the tested students. Students not only adapted well to the initial programming at ISCA but also continued to increase in performance throughout their training with an average 6% increase in performance in the third trimester alone. A great bond formed between the students over the course of the year as they grew closer through their training, group activities, and field trips.
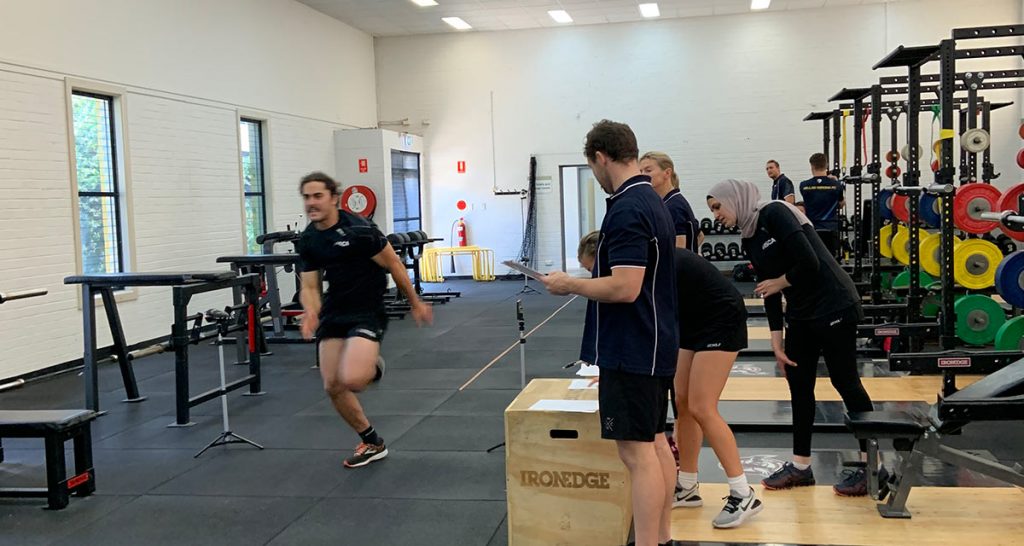
Testing was conducted during week 11 of trimester 3 with the ISCA athletes.
Day 1 of testing
On the first day of testing, all of the athletes undertook a functional movement screen and strength test. It was encouraging to see that any of the athletes coming back from injury/surgery were at least the same if not better than their pre-injury status with almost all athletes showing significant improvements in every area. This was a testament to the effort put in the gym by the cohort in trimester 3, and the programming focusing on the improvement of strength and power of the students. The functional movement screen involved a test in which students were required to complete 7 functional movements to the best of their ability and given a score from 0-3 (3 being the most efficient). A total out of 21 was given to the students indicating areas which needed improvement for movement efficiency. This was a great way to assess the previously injured athletes on their return to play status and improvements for other students from the program and extra mobility drills added throughout the year.
The strength testing was comprised of 3 lifts (Bench Press, Bench Pull, and Back Squat) and the students were asked to complete their 3 rep max lift. Once these were determined for each lift, they also undertook a chin-up hold for as much time as possible.


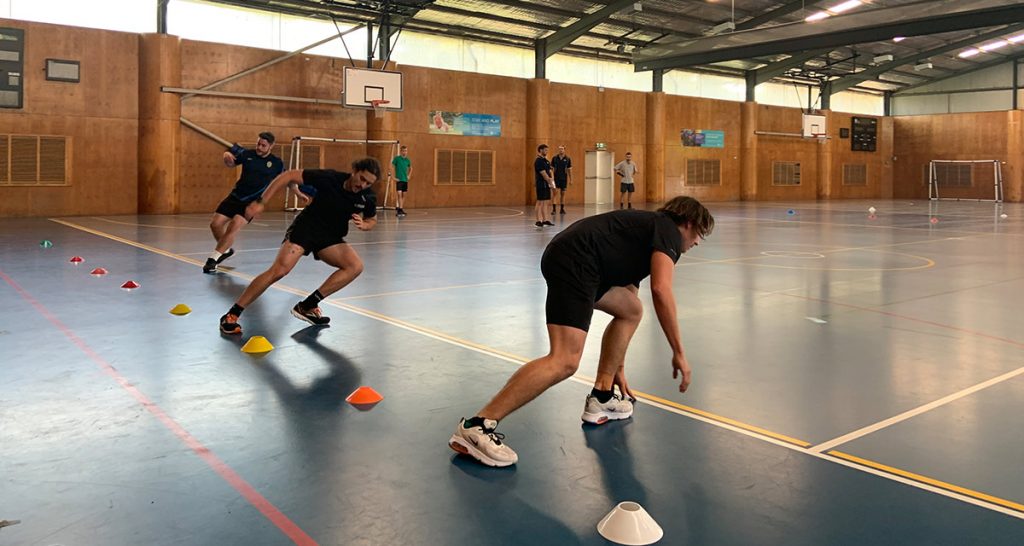
Day 2 of testing
On the second day of testing, the sport science team at the academy of sport helped out to conduct anthropometric testing (skin folds, height, and weight), vertical jump height, sprint and acceleration speed, change in direction speed, and aerobic capacity. All athletes undertook the anthropometric testing, vertical jump test, 40m sprint (10m and 20m split times as well) test, 5-0-5 agility test, and yo-yo-intermittent recovery test.
Results
Over the course of the year the students have made significant gains in strength, speed, lower limb power and upper body strength endurance. Overall, on average throughout the cohort that we tested we saw increases of;
- Vertical jump by 13.2% (increased lower limb power)
- 10m sprint times by 6.5% (increased acceleration)
- 40m sprint times by 3.1% (increased max speed)
- Change in direction by 2.1% (average across both legs) (increased agility)
- Yo-yo by 2.6% (increased aerobic endurance)
- Bench Press by 21.1% (increased upper body strength)
- Bench Pull by 13.4% (increased upper body strength)
- Back Squat by 87.8% (increased lower body strength)
- Chin-up Hold by 187.1% (increased upper body strength endurance)
As seen in the graph below:

This is an overall average increase in performance of 34% over the course of the year (30 weeks of training) from the tested students. Two of our best performing students included Eman who managed to increase her athletic performance by an average of 34.8% across all measures, and Aidan who increased his athletic performance by an average of 31.7% across all measures.
It is great to see that the students not only adapted initially to the programming at ISCA but have also seen increases in performance measures continue throughout their training with an average 6% increase in performance in the last trimester alone. The students that had to undergo surgery mid-year from pre-existing injuries have significantly benefitted with their rehabilitation from the program as well. Sam who underwent a knee reconstruction has come back from the surgery and increased his pre-injured vertical jump by 9.3% and his 10m acceleration by 4.7%. Sarah who underwent a shoulder reconstruction and has been focusing on the rehabilitation of the area while working on the maintenance of lower limb strength and power has managed to increase her vertical jump, sprint speeds, and change of direction while increasing her back squat by 3.5% at the same time. Once again, some of the better performing students have managed to see further increases since the last testing battery in August with Ben improving his strength gains by a further 16%, and Max increasing all his performance markers by an average 10.7%.
It was great to see all of our students from the start of the year participate in the testing this time around. We managed to see some significant improvements across the board which can be credited to the effort put in by the students. It was also encouraging to see a great bond form between the students over the course of the year as they grew closer through their training, group activities, and field trips.
Once again some of the limitations to the process are that injured athletes can cause a gap in the data which doesn’t allow for comparisons between testing sessions. Sick or absent athletes also create gaps in the data. This limitation was mostly remedied from last trimester with a majority of the previously injured athletes able to be tested and 1 student absent due to a fresh injury (unrelated to sport). It would also be unwise to take total credit for all of the performance gains made by the ISCA students as often they were undertaking further sessions (whether it was in the field or gym) with their own sports clubs which must also be attributed to their success over the course of 2019. However the results do indicate that ISCA is able to work with these clubs in the best interest of their athletes to help increase athletic performance, reduce risk of injury, and assist in rehabilitation of injury.
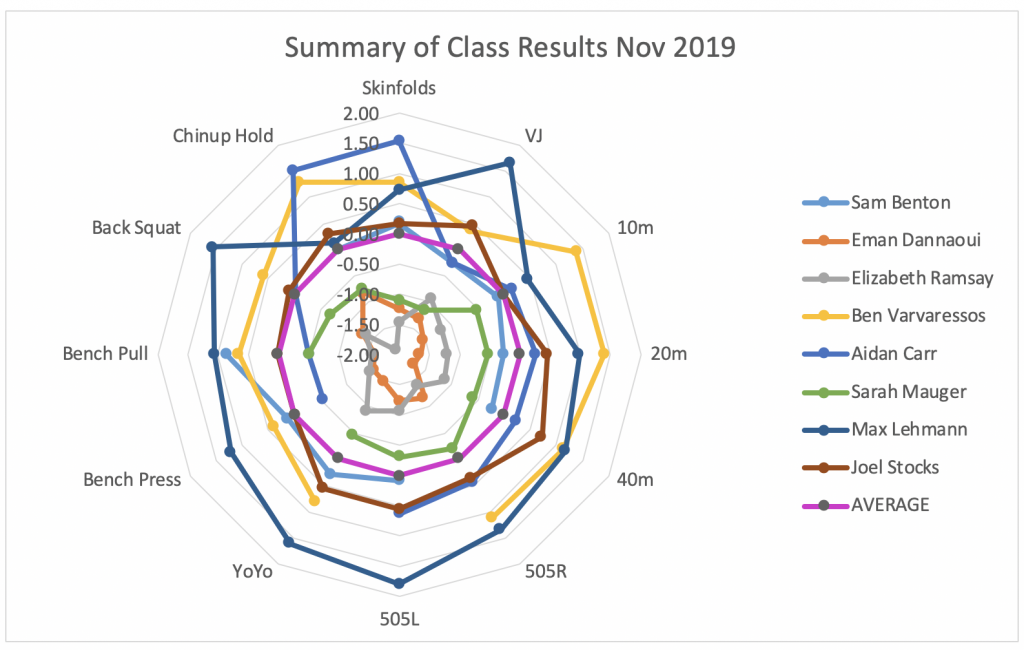
Below is a graph comparing the class amongst themselves. It is interesting to see how different athletes from various sports compare as well as where some athletes might need improvement. A score above 0 (outside the purple line) is above average and below (inside the purple line) is below average.